Hi, I'm Amr Mohamed
I'm a
As a data analysis specialist, driving business growth through data-driven insights and strategies. Simultaneously, my objective is to continue developing and delivering effective data analysis training.

As a data analysis specialist, driving business growth through data-driven insights and strategies. Simultaneously, my objective is to continue developing and delivering effective data analysis training.
Transforming raw data into actionable insights using advanced analytics, visualization tools, and statistical methods to drive business decisions.
Designing interactive dashboards, creating data models, and implementing DAX calculations to visualize complex business metrics.
Teaching data analysis techniques, Power BI, Excel, Python and SQL through hands-on projects and real-world case studies.
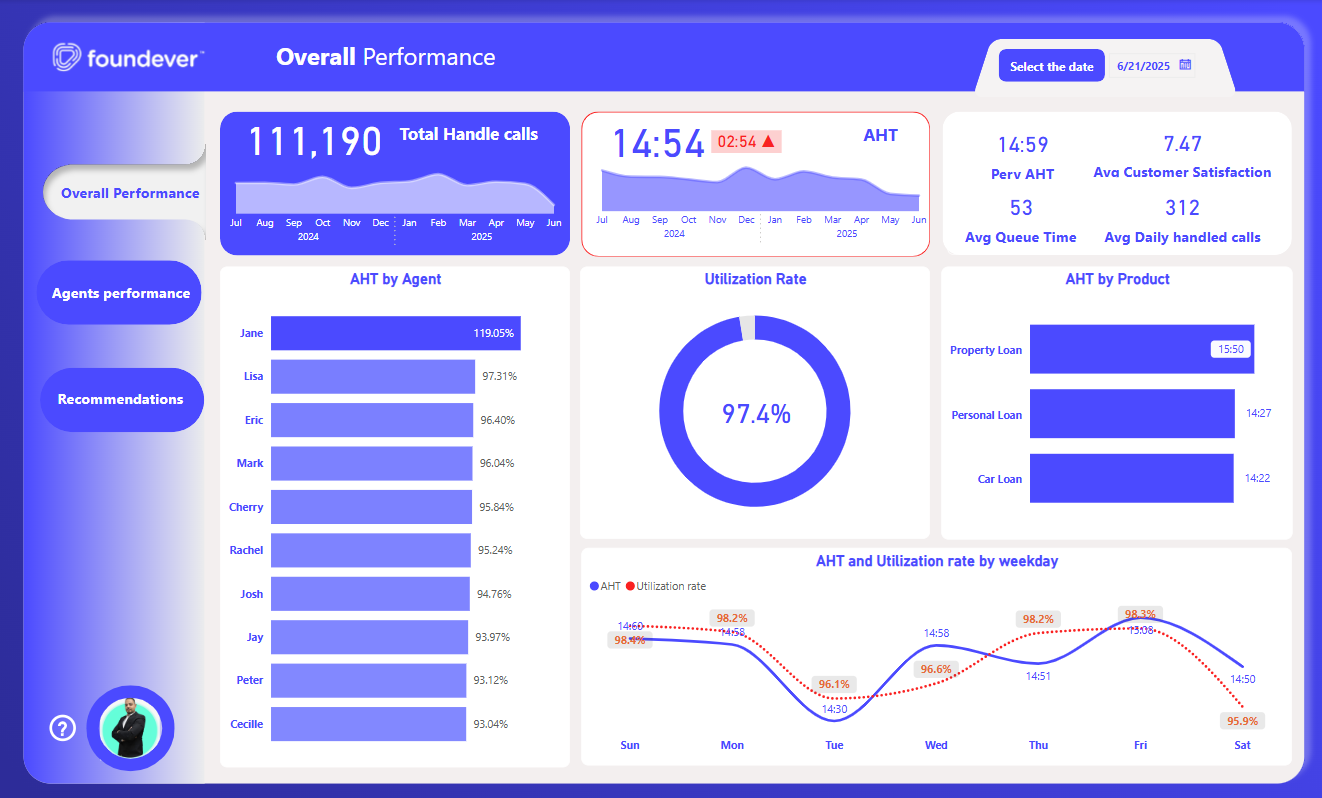
An interactive call center performance dashboard showcasing key metrics like handled calls, agent utilization, average handling time (AHT), queue time, and customer satisfaction. It highlights individual and overall performance, identifies workload imbalances, and supports data-driven decisions to improve efficiency and service quality.
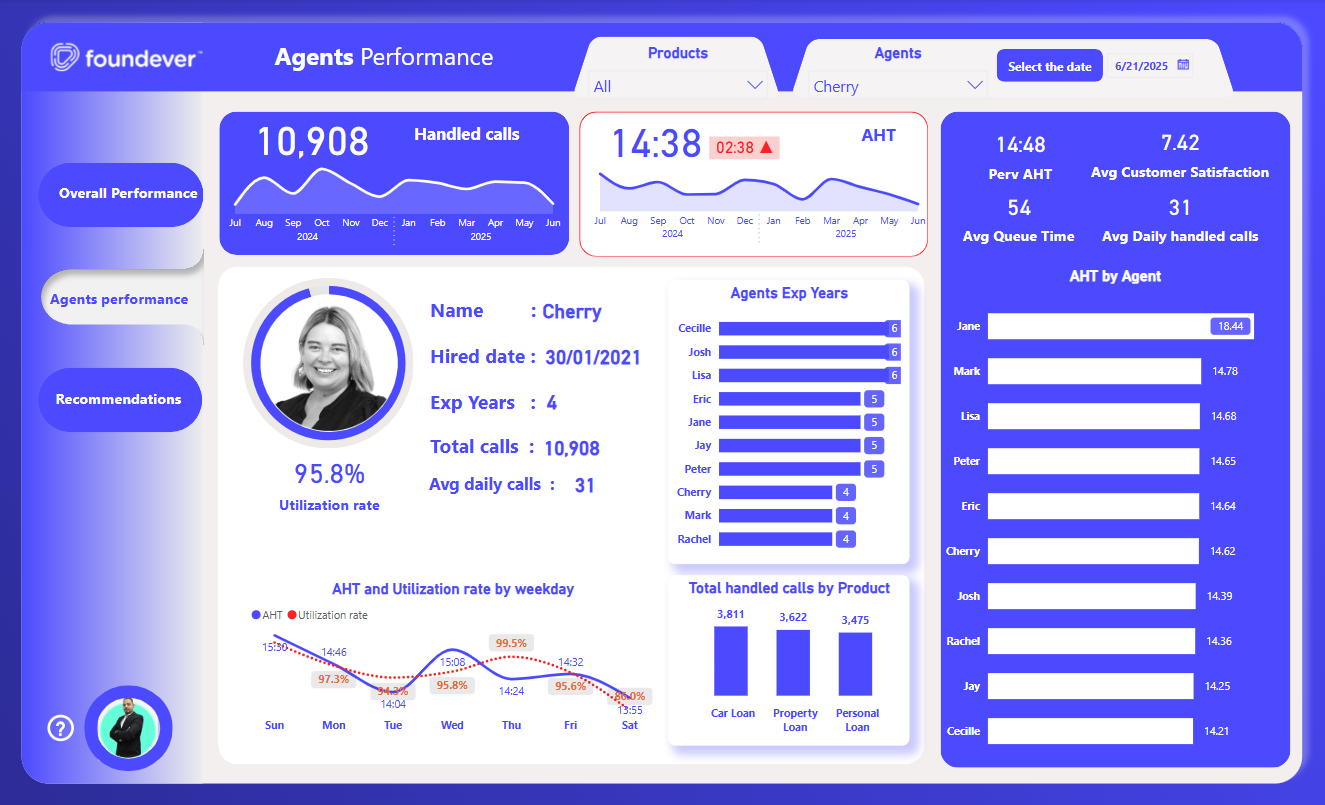
A detailed dashboard highlighting individual agent metrics, including total handled calls, AHT, utilization rate, experience, and product-level performance. It helps monitor agent efficiency and identify top performers or areas needing support.
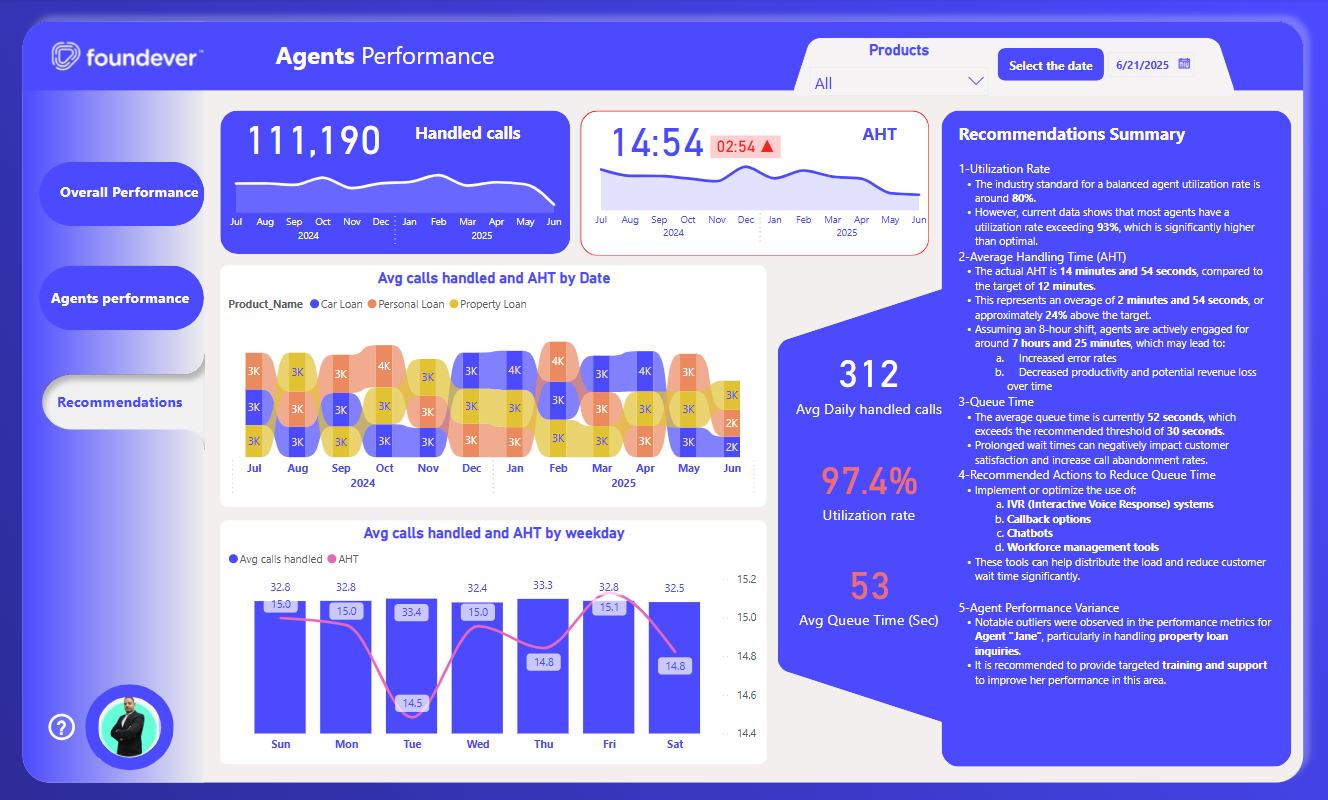
A strategic dashboard combining performance analytics with actionable insights. It summarizes key issues like high AHT and queue times, highlights agent-specific gaps, and recommends process improvements to optimize service delivery.
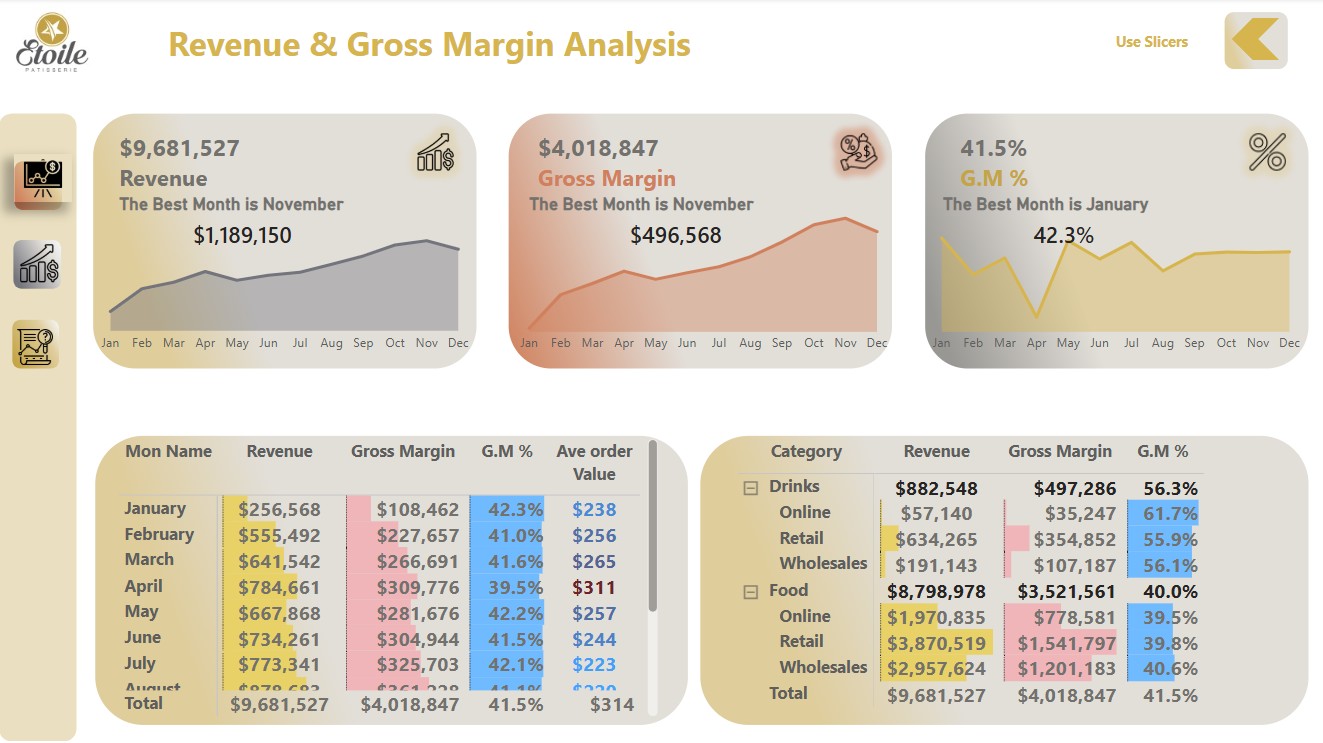
A financial performance dashboard analyzing annual revenue, gross margin, and profitability trends. It highlights top-performing months, category breakdowns, and key metrics like average order value to support data-driven business decisions.
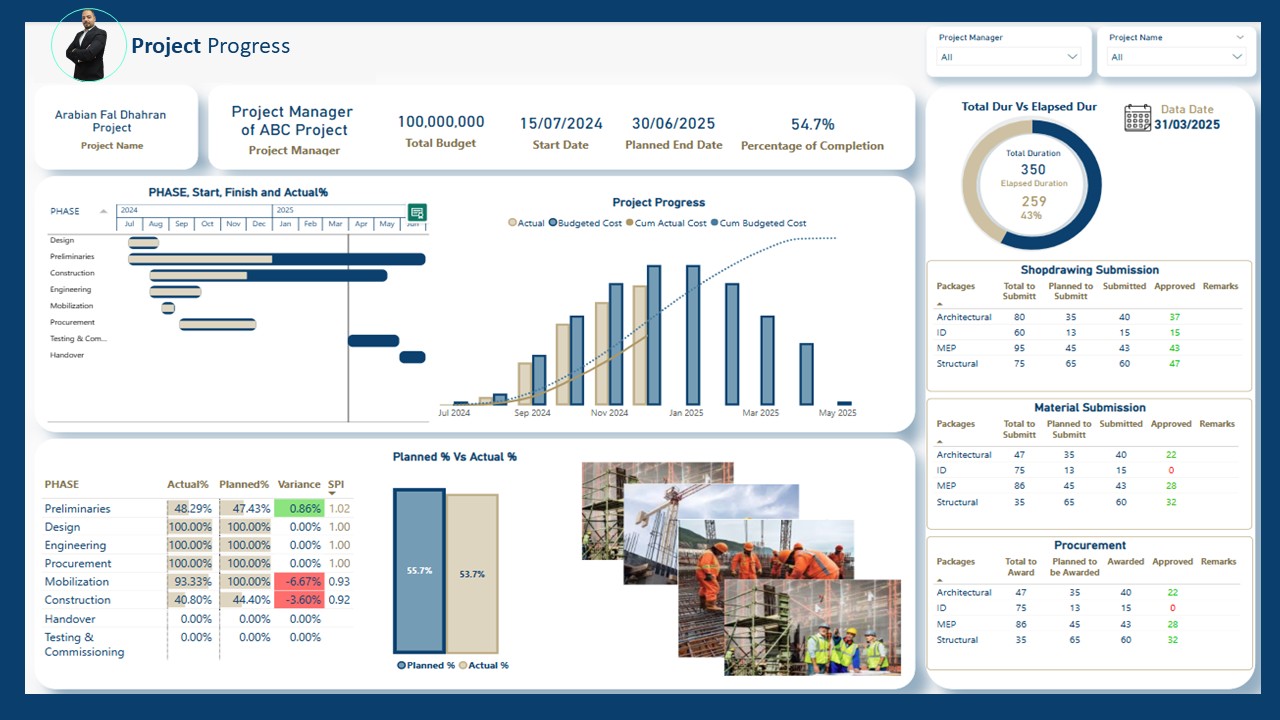
project management dashboard offering a summarized view of progress, cost, schedule, and submission statuses. It highlights planned vs. actual performance, key completion percentages, and visualizes overall project health for effective monitoring and decision-making.
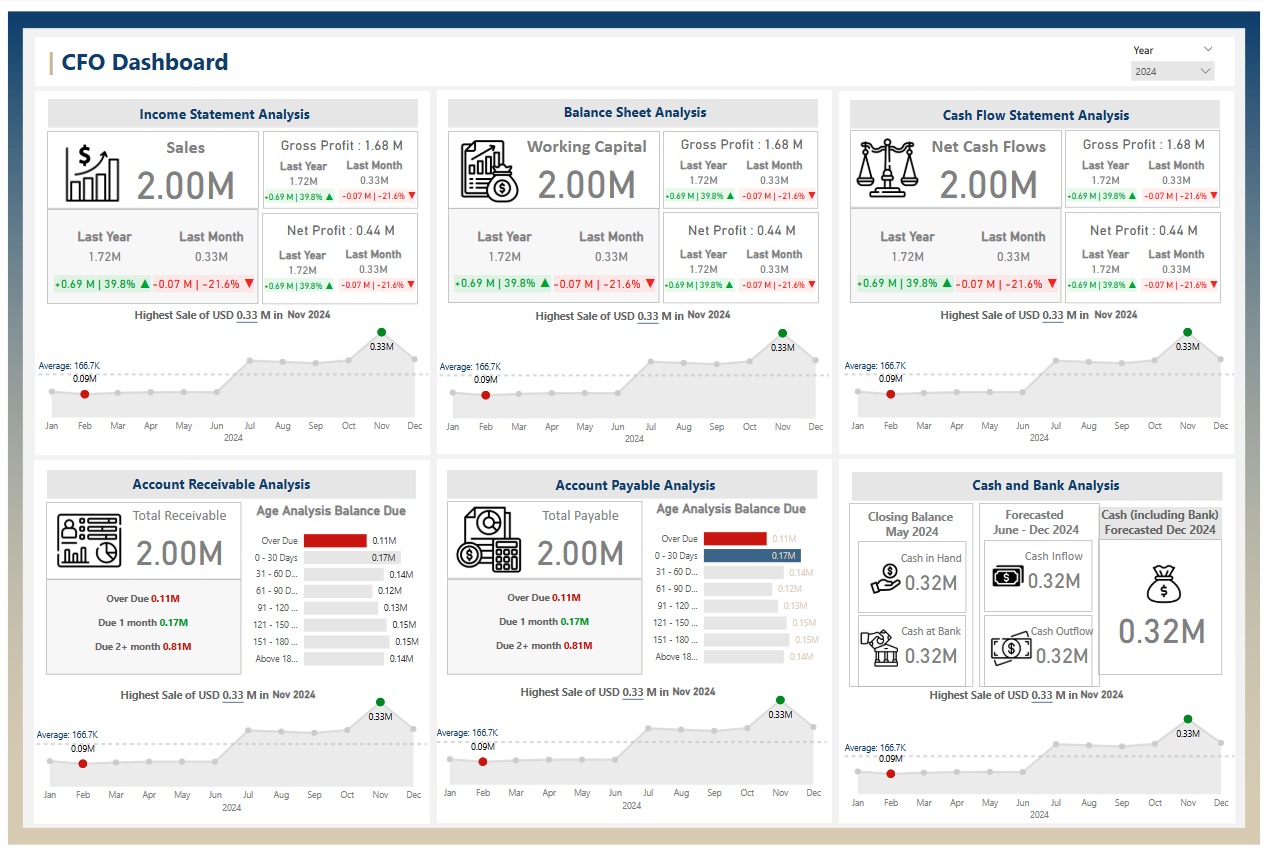
A dynamic financial dashboard that visualizes key metrics such as sales, profit, cash flow, receivables, and payables. It compares monthly and yearly performance, highlights trends, and supports data-driven decision-making for financial management.
I am a data analysis specialist with a passion for transforming complex data into actionable insights that drive business growth. With experience in both Egypt and Saudi Arabia, I have a proven ability to establish and manage data analytics departments, develop strategic plans, and implement effective data solutions.
In addition to my practical experience, I am also dedicated to sharing my knowledge and have developed and delivered data analysis curriculum to enhance students' skills and prepare them for the field. My expertise lies in leveraging tools like Power BI, MS Excel, SQL, and Python to analyze data, create compelling visualizations, and communicate findings clearly.
I am dedicated to helping organizations and individuals make informed decisions through data-driven strategies and continuous improvement.